Calibration: Forecast Width & Rolling MAE
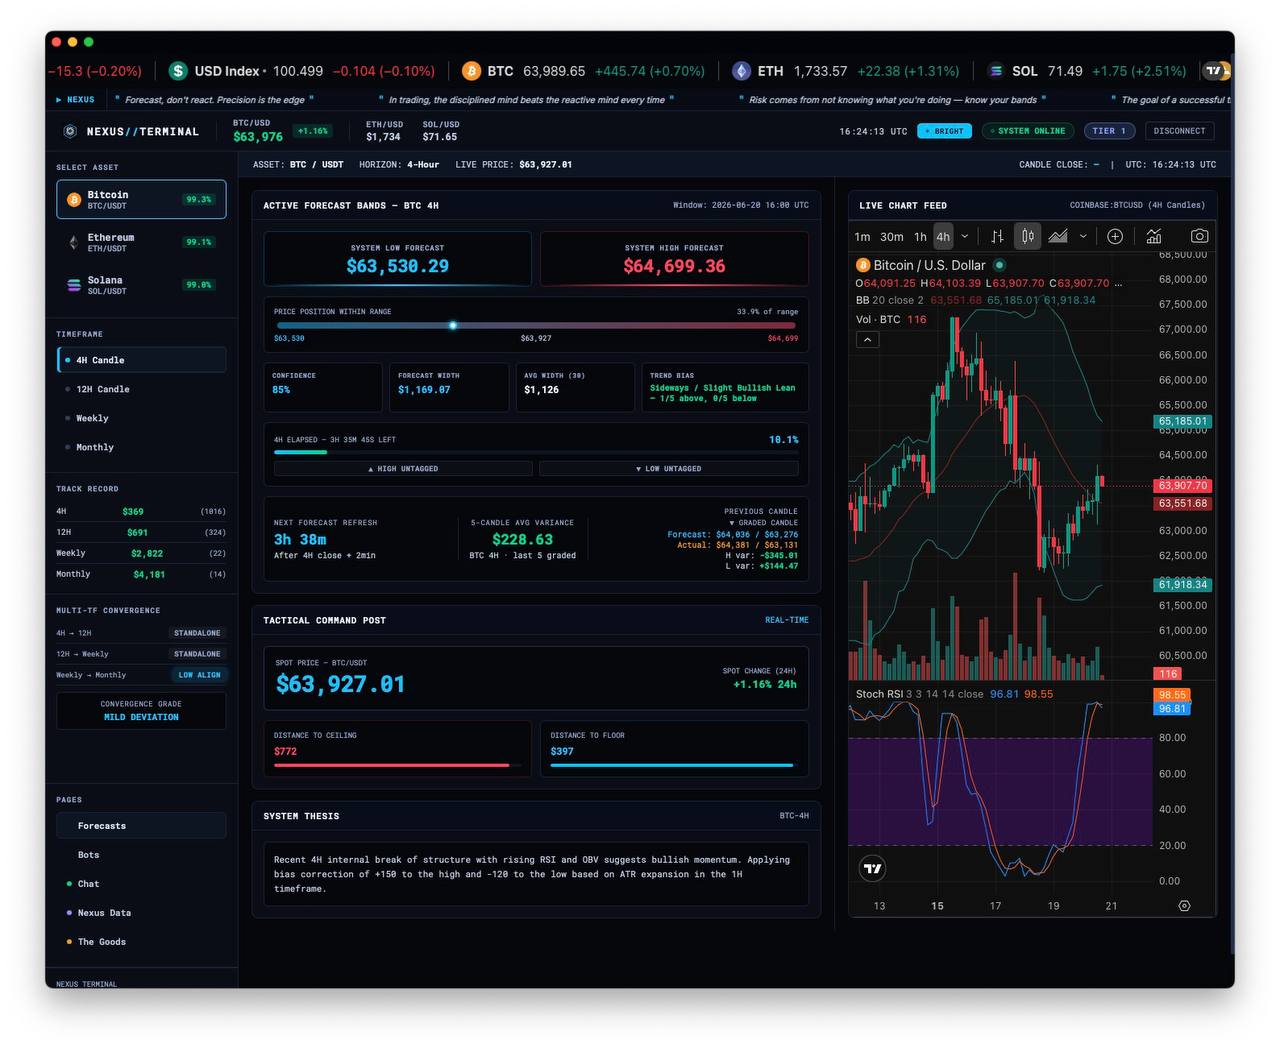
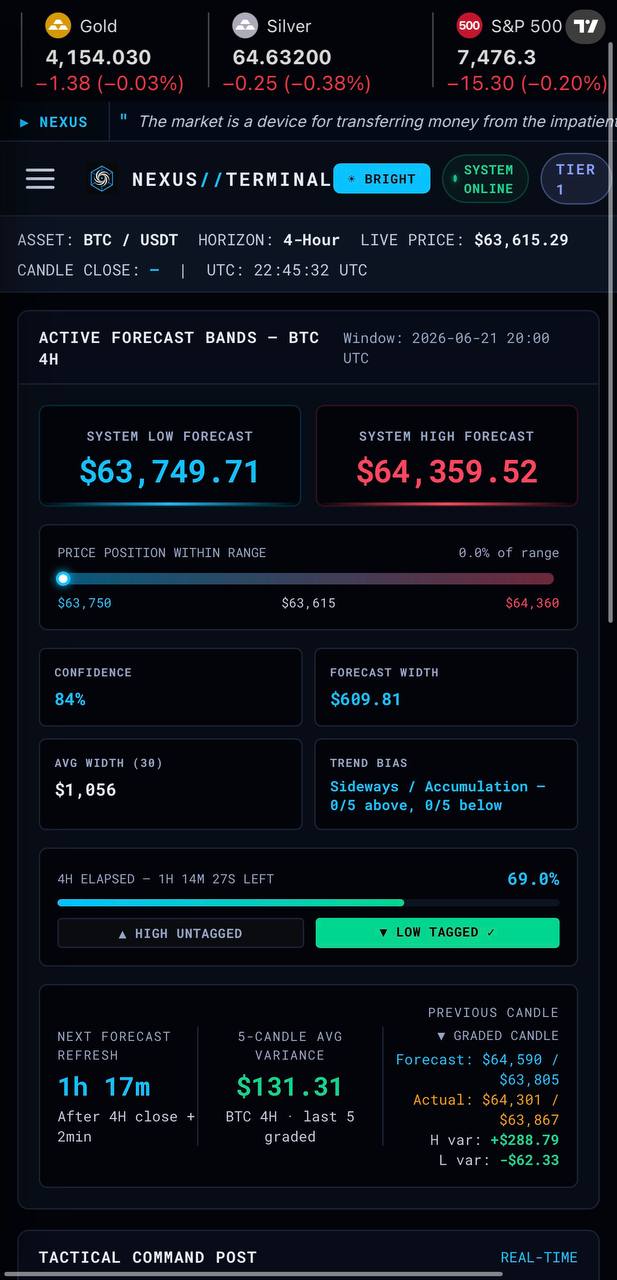
The Forecast Band
System High Forecast / System Low Forecast — The projected range for the candle. These are the levels to watch: does price stay inside the band, break above, or break below?
Forecast Width: $317.94 — The band size. Tells you how much volatility the system expects for this candle.
Avg Width (30): $587.15 — The average band width over the last 30 candles. If the current forecast width is well below the average, the system expects compression; well above it, expansion.
📐 How to Use This
Compare Forecast Width against Avg Width (30). A much wider band than usual means the system sees something — higher conviction levels, sharper moves expected. A tight projection in a normally volatile window is a flag to watch closer.
5-Candle Rolling MAE
A moving snapshot of recent precision:
$137.80 — the average miss (Mean Absolute Error) across the last 5 graded candles, combining both sides of the band. The Terminal also tracks a 30-candle Rolling MAE per timeframe so you always know the current precision regime.
🧠 The Reality Check
Rolling MAE is your calibration tool. If the 4H Rolling MAE is $137 and the band is $300 wide, the system has been landing tight. If MAE has been swelling, give the edges more respect. Judge every new forecast in the context of the current precision regime — the numbers to do it are always on screen.
Weekend vs Weekday
Weekend candles behave differently. Lower volume, wider spreads, less noise but also less conviction. This is one of the most common sources of surprise for new subscribers.
What you'll notice: Weekend forecasts often show tighter projected widths and more neutral bias. The system isn't guessing less — the underlying structure is genuinely flatter.
⚠️ The Weekend Trap
A weekend range that looks "safe" can get violated immediately when Monday volume returns. Sunday night into Monday morning is the most common transition period for a forecast to get caught offsides.
How to adjust:
- Give weekend forecasts more breathing room on the edges — expect wider actuals than the projection suggests
- Monday opens often test or break the weekend range — pay extra attention to Sunday night / Monday morning forecasts
- If you see a post-weekend forecast with wider-than-average projected width, that's the system accounting for the volatility re-entry — take it seriously
How to Use This in Practice
Nexus is a range forecaster, not a buy/sell signal. Here's how it fits into real trading:
Set expectations before the candle opens
You know the projected high and low before price moves. You can plan entries, exits, and invalidation levels in advance instead of reacting.
Watch the edges
The high and low targets are the levels that matter. If price approaches the high target and the bias is bullish, you have context for a potential breakout. If it approaches with bearish bias, the top of the range becomes resistance. Same logic for the low target with inverted bias.
Check the Rolling MAE
Rolling MAE is your calibration tool. It tells you exactly how far the bands have been missing lately, in dollars. Know the recent precision before acting on any single forecast — the Terminal shows it per asset and per timeframe, updated with every graded candle.
Use the thesis as confluence
The thesis gives you the structural story. If it aligns with your own read, that's confirmation. If it contradicts, that's a flag to look closer. You don't have to agree with it — but you should know what it's seeing.
Don't trade every forecast
The best users of Nexus are selective. High-confidence forecasts where the thesis matches their own read are the ones to plan around. Low-confidence or uncertain-bias forecasts are a signal to sit out. The system tells you when it's less sure — listen to that.
How the Track Record Works
Every forecast is graded the same way:
Each closed candle produces a graded receipt: PERFECT HIT (both sides landed well inside tolerance), IN MAE RANGE (misses within the published threshold), ONE-SIDE BREACH (one side exceeded it), or MISS.
Alongside the grade, every miss is measured in dollars — High Error, Low Error, and candle MAE — and rolled into the 30-candle Rolling MAE you see in the Terminal and on the public track record.
This is a deliberately transparent standard. Most "forecast" products hide their misses. Nexus publishes every error in dollars, live, for every market — the receipts are the product.
The track record on the site updates automatically: all-time, 90-day rolling, and 30-day rolling. Every forecast gets graded. No snapshots, no cherry-picked periods.
Common Questions
What if a forecast misses?
Forecasts will miss. No system is perfect. The question is whether the misses are informative — whether you can see why a forecast missed and adjust accordingly. The Rolling MAE is designed exactly for this: it gives you the context to evaluate the next forecast in light of recent patterns.
Can I combine this with my own analysis?
Yes — that's the intended use. Nexus gives you a structured, accountable range forecast. Your job is to use it alongside your risk management, entry rules, and market judgment. The thesis tells you the system's reasoning. The Rolling MAE tells you its recent precision. You bring the strategy.
How often do forecasts update?
Every candle close for your subscribed timeframes. 4H = every 4 hours. 12H = twice daily. Weekly = once per week. Monthly = once per month. Each arrives in your Nexus Terminal automatically, with optional push alerts on desktop and mobile.
Who should NOT use this?
If you want entry signals, take-profit targets, or someone to tell you when to buy and sell, Nexus is not that product. It's a range forecaster. It tells you where price is likely to trade, not what to do about it. That's intentional — your strategy is yours.
The system delivers structured, accountable forecasts before every candle. You bring your strategy, your risk management, and your judgment. Nexus brings a clear, consistent read of what's coming next.